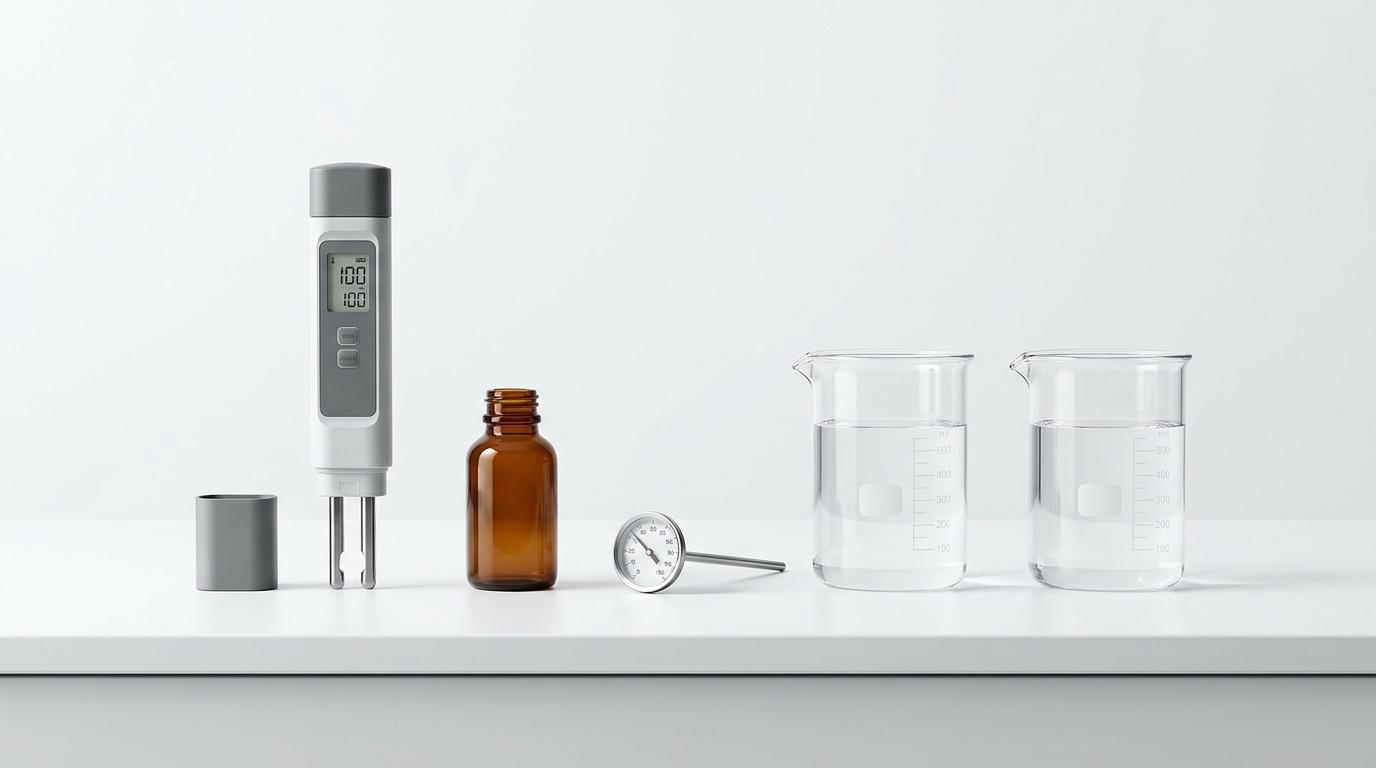
1. TDS Rejection Formula & Meter Calibration
Rejection rate is calculated from feed (tap) total dissolved solids and permeate (RO) total dissolved solids:
Rejection (%) = (1 − (RO TDS / Tap TDS)) × 100
This aligns with standard residential evaluation practices under NSF/ANSI 58 (Reverse Osmosis Drinking Water Treatment Systems). Note that handheld TDS pens actually measure electrical conductivity (µS/cm) and multiply by a conversion factor—commonly 0.50 (NaCl scale) or 0.70 (442 natural water scale).
Worked Calibration Proof: Suppose actual water conductivity is
640 µS/cm at the tap and 36 µS/cm at the RO membrane. A 0.50 NaCl pen displays 320 ppm → 18 ppm ((1 − 18/320) × 100 = 94.4%). A 0.70 442 pen displays 448 ppm → 25.2 ppm ((1 − 25.2/448) × 100 = 94.4%). As long as you measure Point A and Point B with the same meter at roughly the same temperature, the conversion factor cancels out completely.
Temperature & Pressure Sensitivity
- Temperature Compensation: Water conductivity rises roughly ~2% per °C (~1.1% per °F). Most quality handheld pens include Automatic Temperature Compensation (ATC) normalized to 25°C (77°F); if using an uncompensated pen, let both tap and RO glasses sit 10 minutes to reach room temperature.
- Cold Water Flux Drop: NSF/ANSI 58 standard qualification testing uses 50 psig ±5 psi feed pressure, 77°F (25°C ±2°C) temperature, and a 750 mg/L NaCl challenge solution. In winter when incoming cold water drops to 45–50°F, water viscosity increases and membrane production slows by 30%–40%, even though TDS rejection percentage remains normal.
2. How NSF/ANSI Standards Divide RO Performance
| Standard | What It Certifies | Why It Matters for Your System |
|---|---|---|
| NSF/ANSI 42 | Aesthetic effects (chlorine taste, odor, particulate) | Covers your carbon pre-filters and post-polishing stages that protect taste and shield the membrane from chlorine. |
| NSF/ANSI 58 | Reverse osmosis TDS reduction & specific dissolved contaminants | Sets the mandatory minimum average 75% TDS reduction certification floor at standard test conditions (50 psig, 77°F, 750 mg/L NaCl), along with structural integrity and recovery/efficiency reporting. |
| NSF/ANSI 53 | Health-related contaminant reduction (lead, cysts, VOCs) | Often paired with carbon block stages for chemical/VOC claims that RO membranes alone do not target. |
3. Benchmark Thresholds & Sources
| Parameter | Reference Range | Engineering Basis | Boundary / Exception |
|---|---|---|---|
| TFC Membrane Rejection | ≥ 90% field benchmark (75% NSF floor) | NSF/ANSI 58 minimum certification floor is 75%; healthy residential TFC membranes typically achieve 90%–98% in the field | Must be measured after 30–60 sec flush and before any remineralization stage. |
| Empty Tank Air Pre-Charge | 7–10 psi | Standard bladder tank manufacturer & WQA service practice | Measured only when cold feed is shut off and tank is 100% drained. |
| Minimum Feed Pressure | ≥ 40 psi | Non-pumped ASO shut-off and membrane driving pressure | Systems with an electric booster pump can operate on lower supply pressure. |
| Pre-Filter / Membrane Intervals | 6–12 mo / 2–4 yr | WQA residential maintenance benchmarks | Shortens on high-silt well water, extreme hardness, or chloramine supply. |
4. What a TDS Meter Cannot Detect
A low TDS reading confirms that your RO membrane's semi-permeable barrier is intact against dissolved inorganic ions (such as calcium, sodium, chloride, and many dissolved salts). However, a handheld TDS pen is not a comprehensive water safety lab test:
- It cannot detect uncharged organic molecules (certain VOCs, pesticides, or PFAS) or microbial contaminants (bacteria, viruses, cysts).
- If you are on private well water or suspect microbial/chemical contamination, send a sample to a state-certified laboratory rather than relying on TDS alone.
5. Primary References
- Water Quality Association (WQA) — Residential reverse osmosis technical & maintenance guidance.
- NSF International — NSF/ANSI 58 Reverse Osmosis Drinking Water Treatment Systems overview.
- University of Minnesota Extension — Residential RO operation and discharge considerations.
- U.S. EPA — Drinking water consumer guidance.