Why Raw PPM Misleads Without Feed Water Context
A reverse osmosis membrane does not output a fixed TDS number—it rejects a percentage of incoming dissolved ions. Because municipal tap water across the U.S. varies from under 50 ppm (Pacific Northwest surface water) to over 600 ppm (Southwest and Midwest aquifers), the same healthy 94% membrane produces wildly different glass readings:
| Local Tap Water (Point A) | Healthy RO Range (92%–96% Rejection) | Watch Zone (80%–89%) | Low Rejection (<80%) |
|---|---|---|---|
| 60 ppm (Soft) | 2–5 ppm | 7–12 ppm | > 12 ppm |
| 250 ppm (Moderate) | 10–20 ppm | 28–50 ppm | > 50 ppm |
| 500 ppm (Hard / Well) | 20–40 ppm | 55–100 ppm | > 100 ppm |
Where You Sample Changes the Reading
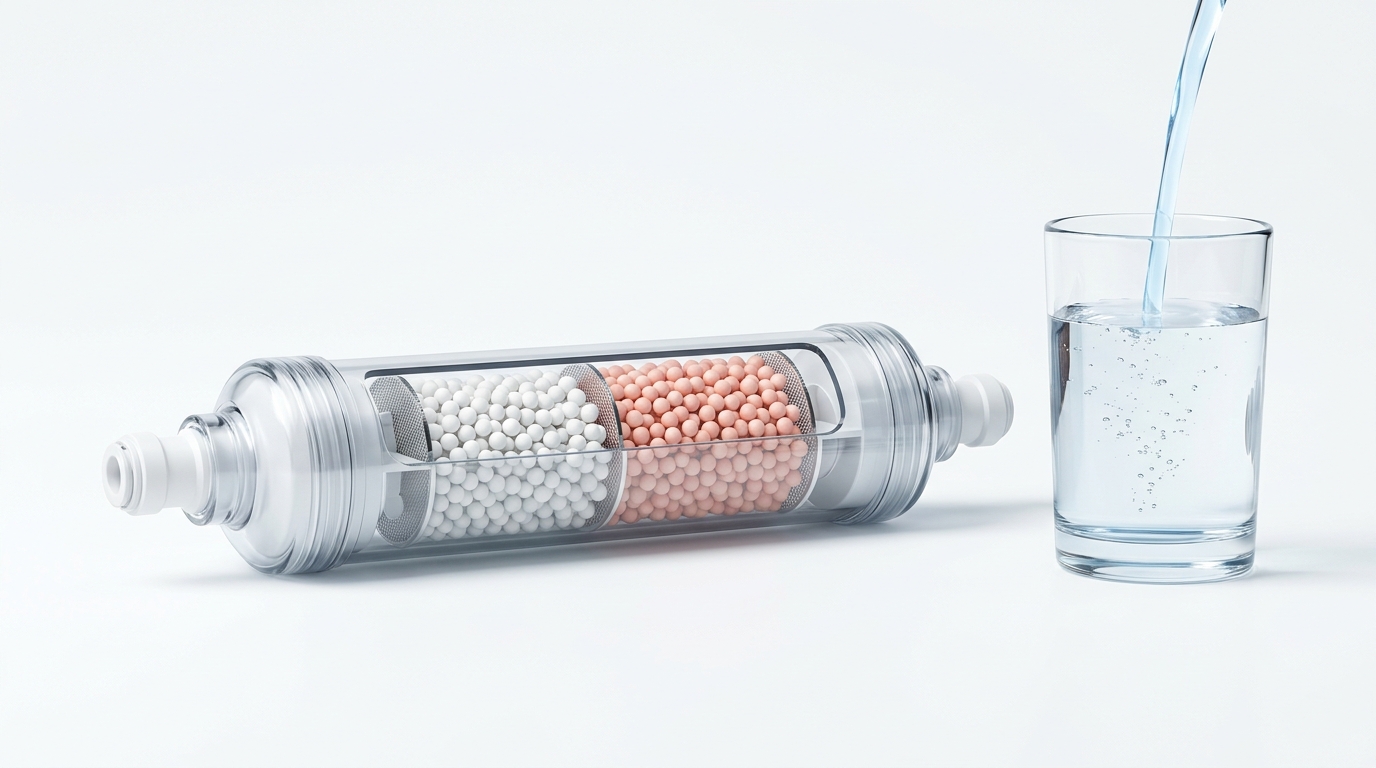
Most false membrane replacements happen because homeowners measure TDS at the kitchen RO faucet without realizing a 6th-stage alkaline cartridge sits downstream of the membrane, or because the first glass of water absorbed standing ions overnight. Always flush a brand-new carbon post-filter or remineralization stage with at least 2–3 full tank cycles before trusting a baseline TDS test—loose carbon fines and fresh calcite dust temporarily spike readings on day one.
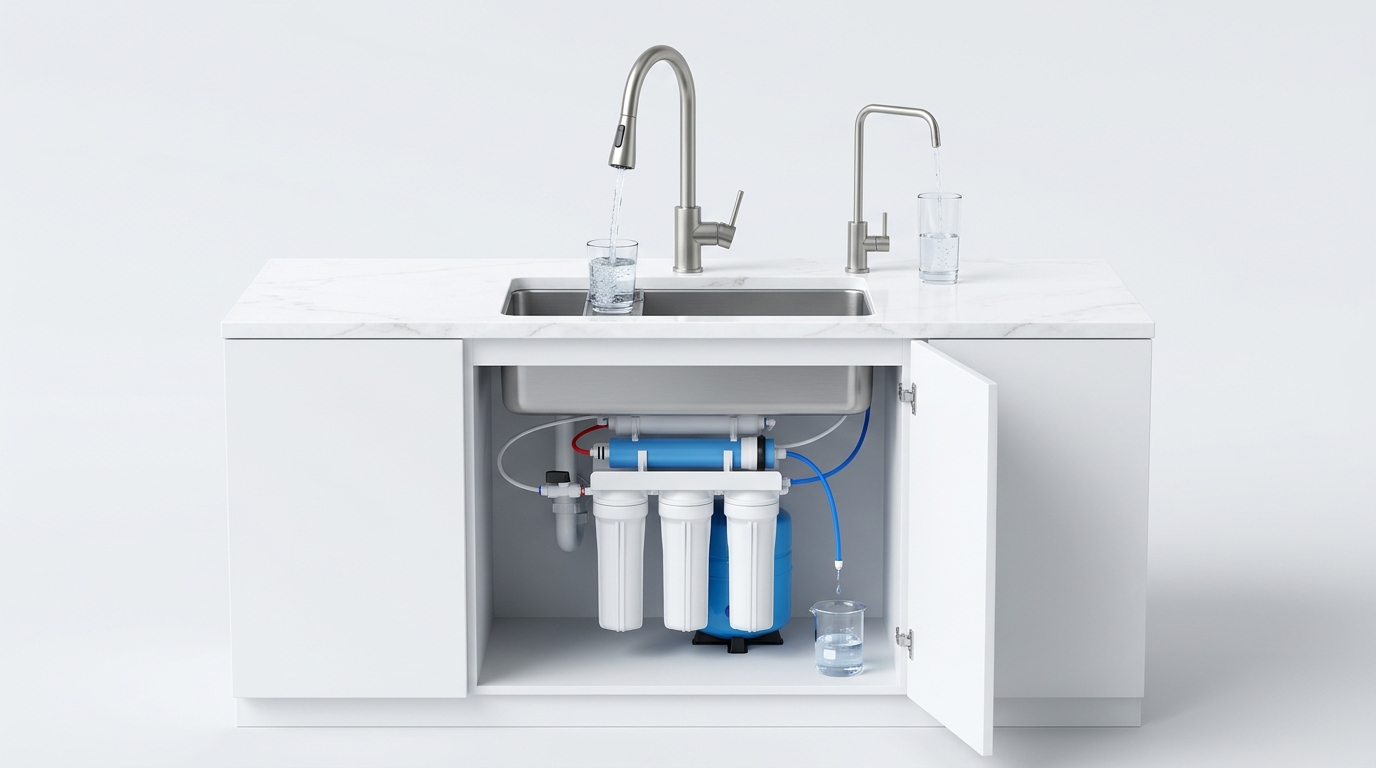
5 Habits for Accurate Handheld TDS Meter Readings
- Rinse the sample glass twice with RO water: Residual tap-water droplets or dish soap residue inside a glass can easily add 10–30 ppm to a small sample.
- Test cold water at room temperature: Never dip a TDS pen into freshly boiled or hot tap water; heat alters ion mobility and can exceed the probe's automatic temperature compensation (ATC) range.
- Swirl gently and wait 5 seconds: Micro-bubbles clinging to the metal pins insulate the electrodes and cause erratic low readings until dislodged.
- Use the same meter for Point A and Point B: Different brands use different conductivity-to-ppm factors (0.50 vs. 0.70), so mixing two meters distorts your rejection ratio.
- Recalibrate annually with 342 ppm NaCl solution if your readings drift noticeably compared with historical tap baselines.
Four Common Real-World Scenarios
Scenario 1: Brand-New Membrane Still Reads 120 ppm
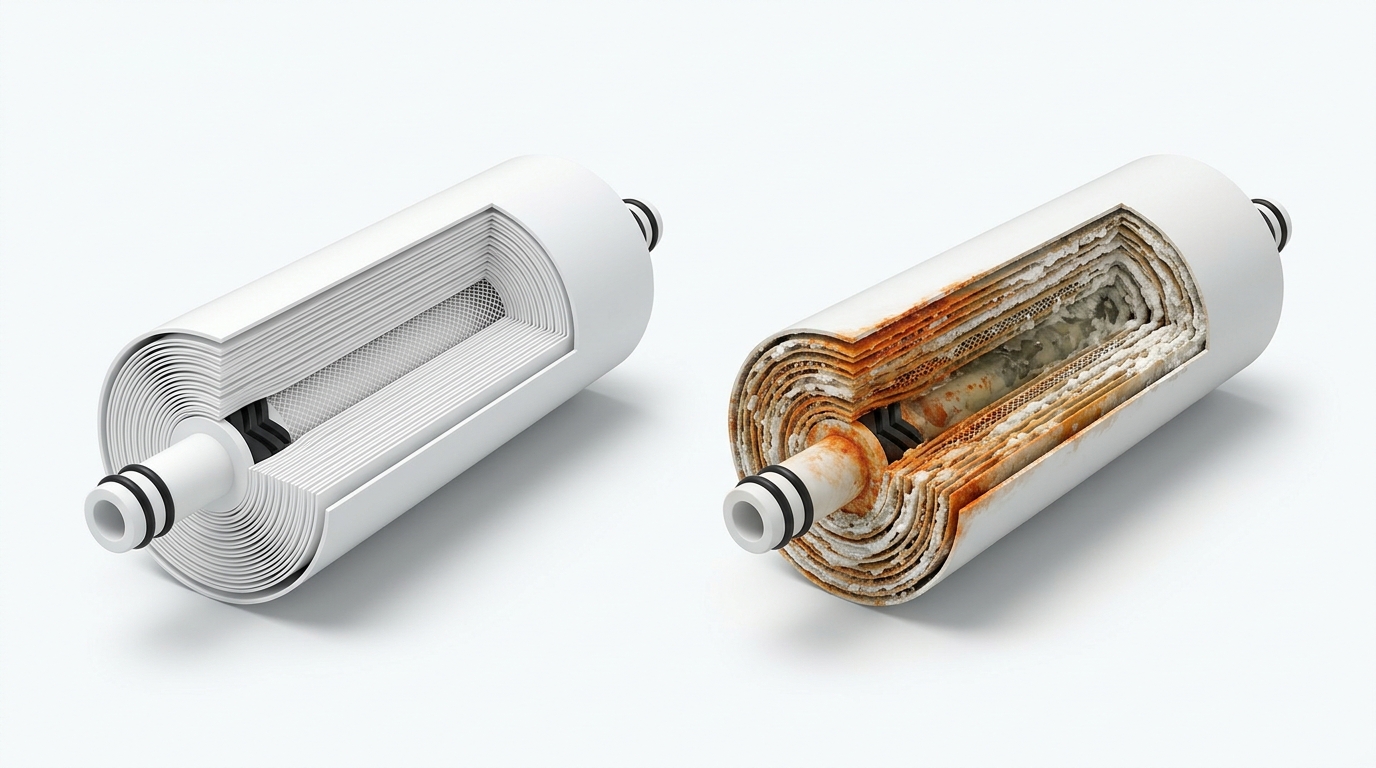
Usually caused by an unseated membrane stem (the double O-rings did not push fully into the bottom socket) or a pinched brine seal allowing raw water to bypass straight into the permeate port.
Scenario 2: Tap TDS Jumped From 180 to 420 ppm
Many utilities blend river water with harder groundwater wells seasonally. Even if your RO rejection stays at 94%, your faucet TDS will naturally rise from ~11 ppm to ~25 ppm—nothing is broken.
Scenario 3: Plastic or Rubber Taste After Filter Swap
New membranes ship with food-grade preservative (often sodium metabisulfite), and new tanks have fresh butyl bladders. Discard the first 2 full tanks completely before drinking.
Scenario 4: Gurgling Sound at the Kitchen Sink
Normal air-gap faucet drainage or drain-saddle flow into the disposal tee. Only worry if the gurgle continues uninterrupted for more than 3–4 hours after shutting the faucet.
Worked Examples You Can Verify
Example 1: Standard 5-Stage RO (Healthy)
Cold tap reads 320 ppm; flushed RO faucet reads 19 ppm.
Rejection = (1 − 19 / 320) × 100 = 94.1%
Example 2: 6-Stage Alkaline RO (False Alarm)
Cold tap reads 250 ppm; faucet reads 55 ppm (78% apparent).
Because a remineralization stage adds ~35–40 ppm of beneficial minerals, testing before the mineral stage typically reveals 12–18 ppm (>92% rejection).
Red Flags That Override TDS Readings
Even if your TDS rejection calculates above 90%, stop drinking from the system and inspect it immediately if you notice any of the following:
- Musty, earthy, or rotten-egg odor: Indicates bacterial biofilm in an overdue post-carbon cartridge, storage tank bladder, or feed line after a municipal boil-water notice.
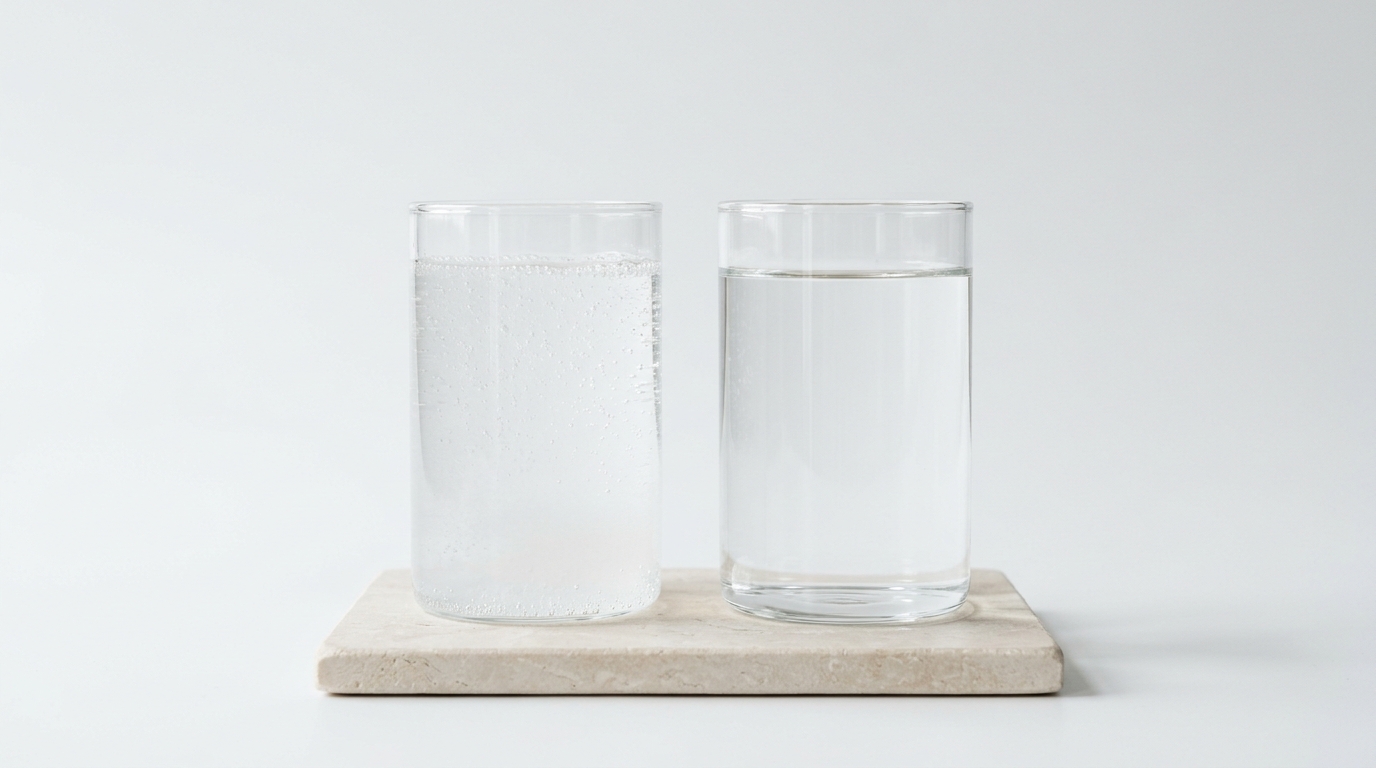
- Cloudy water that does not clear from the bottom up: Tiny micro-bubbles rising and clearing within 30 seconds are harmless dissolved air; persistent turbidity points to a torn seal or leaking housing.
- Visible drips under the sink or around the saddle valve: Shut off the feed valve immediately and inspect push-to-connect collets and O-rings.
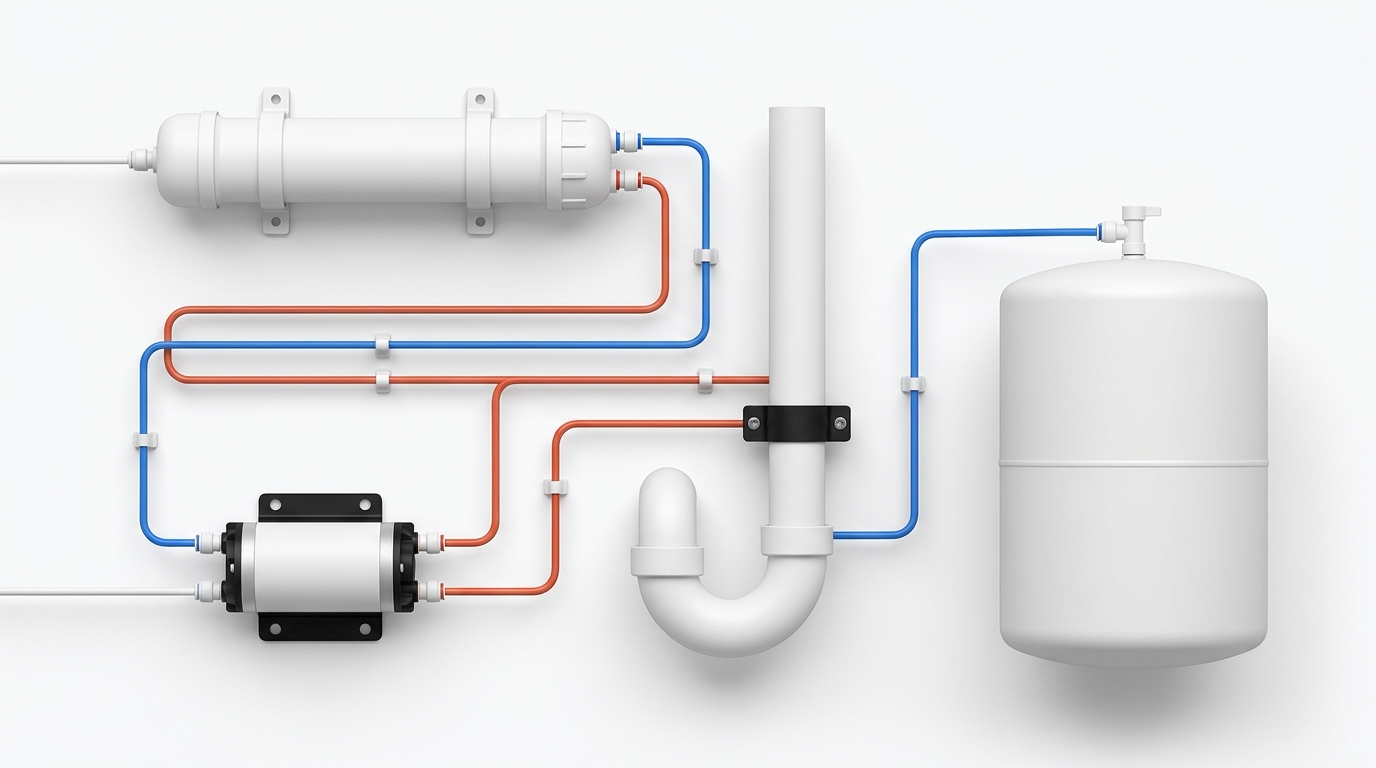
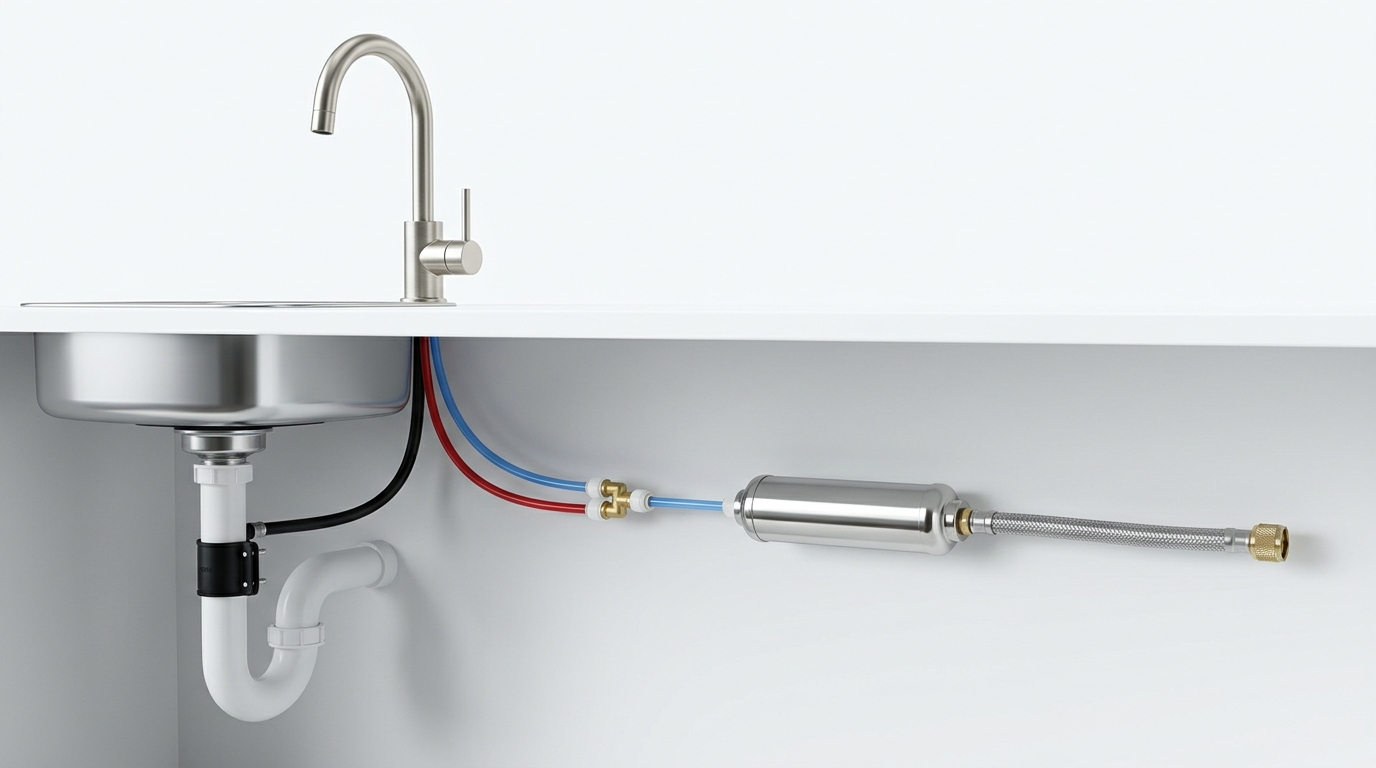
Visual System Atlas: Inside Every RO Component
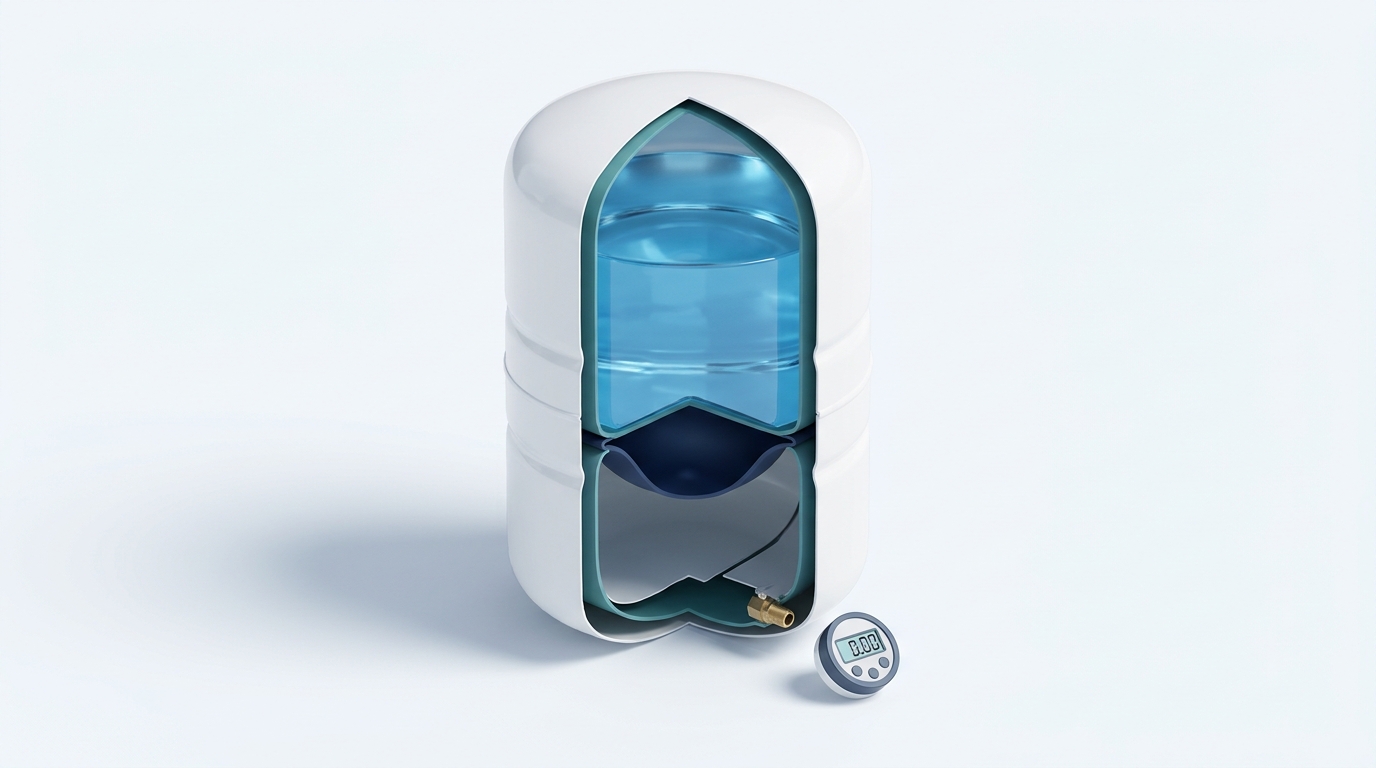
Explore illustrated component cutaways and step-by-step troubleshooting guides across the full residential reverse osmosis loop:
Next Diagnostic Steps
| Observed Symptom | Most Likely Cause | Recommended Tool / Guide |
|---|---|---|
| Drain water runs continuously hours after closing faucet | Low tank air charge (<7 psi), faulty ASO valve, or feed pressure <40 psi | Continuous Drain & Pressure Triage |
| First cup TDS is high, then drops after 30–60 seconds | Normal overnight osmotic diffusion (TDS creep) | TDS Creep & Sampling Guide |
| Slow trickle from faucet, TDS still low (<10% of tap) | Clogged sediment/carbon pre-filters or waterlogged tank bladder | Membrane vs. Pre-Filter Matrix |
| Planning annual filter and membrane budget | 6–12 mo pre-filters + 2–4 yr membrane schedule | Filter Cost & Schedule Planner |
| High water bill or want to cut RO drain waste | Tank back-pressure causing 3:1–4:1 waste ratio | Waste Water & Permeate Pump Calculator |
| Slow fridge ice maker or air-gap faucet side-hole leak | Low delivery psi to fridge valve or kinked 3/8" drain hose | Fridge Hookup & Air Gap Leak Guide |
| Tap still has high TDS after whole-house softener, or low well psi | Ion exchange swaps Ca/Mg for Na; well pressure <40 psi | Softener + RO & Booster Pump Guide |
| Checking fluoride, PFAS, microplastics, or mineral/health claims | Membrane vs. carbon removal limits and dietary mineral context | Contaminants & Health Guide |