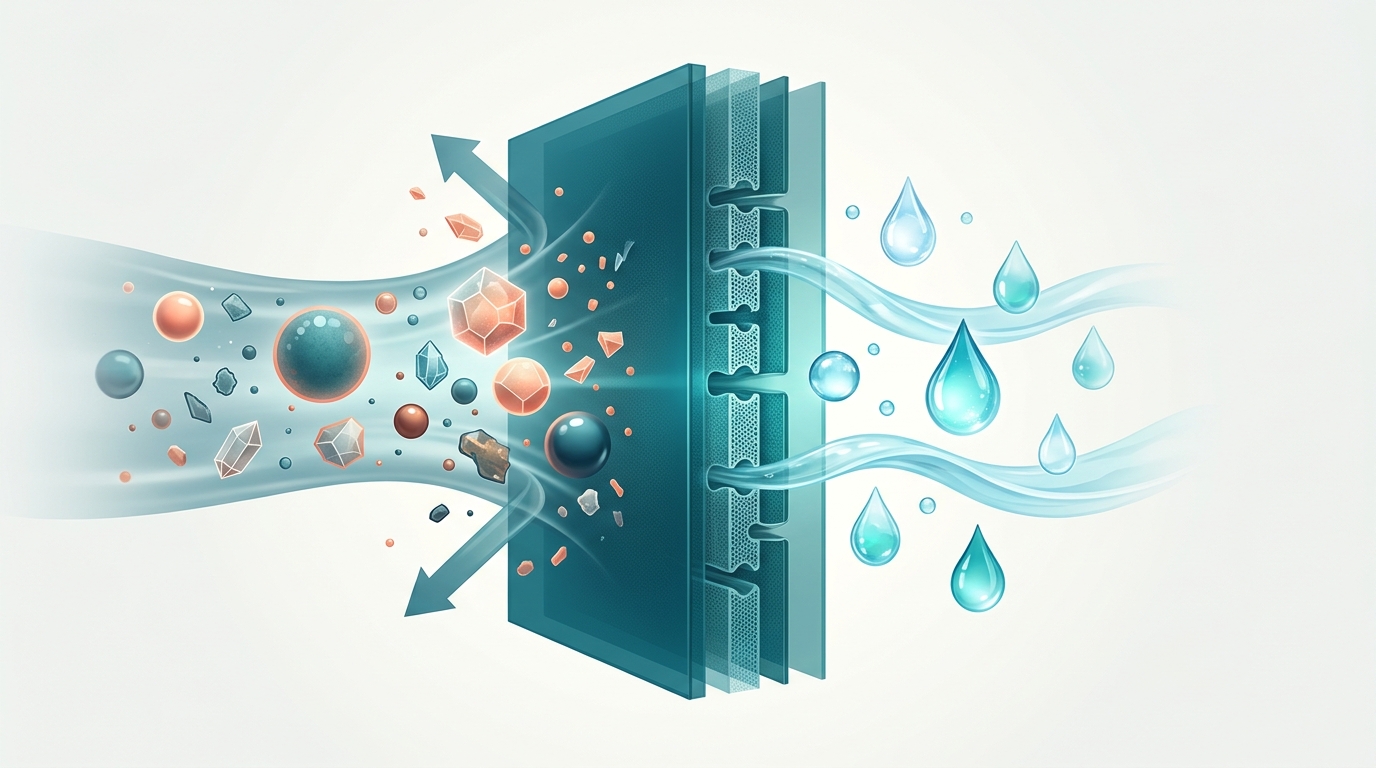
1. Contaminant Removal Matrix (NSF/ANSI 58 & 53 Context)
| Contaminant | Typical RO System Reduction | Key Condition / Limit |
|---|---|---|
| Fluoride | ~85%–95% | Driven by the TFC membrane; maintain ≥40 psi feed pressure and replace aging membranes when TDS rejection drops. |
| PFAS ("Forever Chemicals") | >90%–99% (certified units) | Updated NSF/ANSI 58 & 53 standards lowered the combined PFOA + PFOS effluent limit from 70 ppt to 20 ppt (ng/L) and expanded testing to Total PFAS; compare against the U.S. EPA federal MCL of 4.0 ppt individually for PFOA and PFOS. |
| Microplastics | >99% | Membrane pore size (~0.0001 micron) is thousands of times smaller than microplastic particles; faucet housing cleanliness matters too. |
| Nitrates / Arsenic (V) | ~80%–95%+ | Check your system's NSF 58 data sheet—arsenic (III) requires pre-oxidation on well water for full removal. |
| Chlorine & VOCs | ~95%–99% (via Carbon) | Handled by carbon blocks, not the membrane. Keep carbon swaps on a strict 6–12 month schedule. |
2. "Is RO Water Bad for You?" — The Mineral Reality Check
A frequent concern is whether drinking low-TDS RO water causes mineral deficiency. Looking at actual milligram numbers puts this in perspective: drinking water—even hard tap water—supplies only a tiny fraction of daily calcium and magnesium compared with ordinary food.
| Source (Typical Serving) | Calcium (mg) | Magnesium (mg) |
|---|---|---|
| 1 Liter Standard RO Water | ~0–5 mg | ~0–2 mg |
| 1 Liter Moderate Tap Water (150 ppm) | ~30–40 mg | ~8–12 mg |
| 1 Cup (240 mL) Milk or Fortified Soy Milk | ~300 mg | ~25 mg |
| 1 Ounce (28 g) Almonds | ~75 mg | ~75 mg |
For healthy adults eating a normal diet, RO water does not cause mineral deficiency. If you prefer crisp mineral flavor or neutral pH for coffee, add a calcite remineralization cartridge.
3. Why Freshly Poured RO Water Sometimes Looks Cloudy
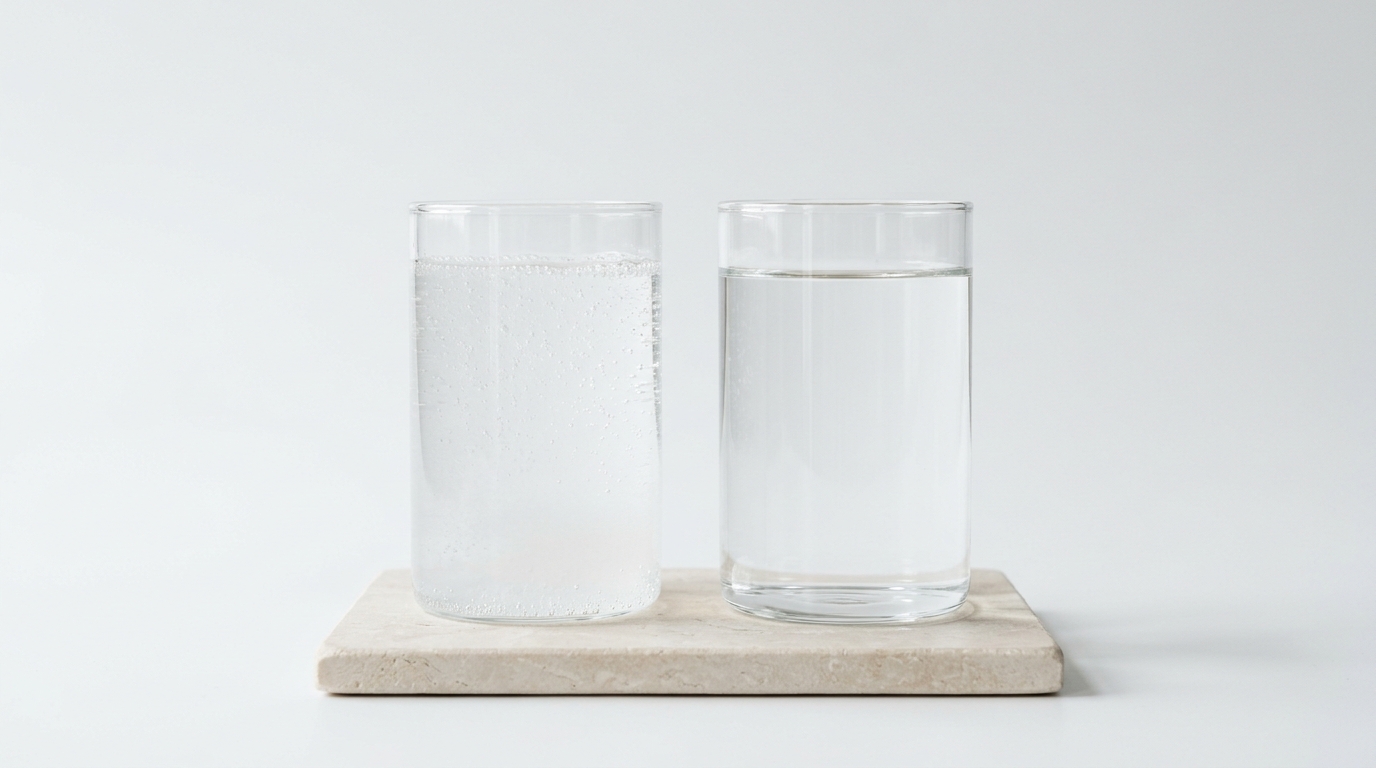
If your RO glass looks milky right after changing filters, recharging the tank, or installing a new unit, watch the glass for 30–60 seconds: if it clears from the bottom upward, it is harmless dissolved air micro-bubbles escaping under pressure—not sediment or bad filters. Also note that indoor houseplants watered exclusively with pure 0–10 ppm RO water still need occasional balanced fertilizer, because tap water's trace calcium and magnesium are removed.